


Q1 2014/ ISSUE 01
In 2013, the SRS grew by 8.6 million GT (13.2%) from 65.0 million GT to 73.6 million GT. The strong tonnage growth was largely attributed to the fleet renewal and fleet expansion plans implemented by existing shipowners as well as tonnage contribution from new shipowners. While more than 90% of the 2013 tonnage increase came from the dry bulk and container segments, the offshore segment also enjoyed good growth with more drilling rigs being registered.
| Vessel Type | 2012 SRS tonnage (million GT) | 2013 SRS tonnage (million GT) |
|---|---|---|
| Tanker | 22.54 | 23.06 |
| Bulk Carrier | 16.28 | 20.69 |
| Container | 13.31 | 16.95 |
| General Cargo | 2.16 | 2.21 |
| Offshore Units | 2.22 | 2.28 |
| Car Carrier | 2.96 | 2.89 |
| Gas Carrier | 2.45 | 2.03 |
| Others | 3.09 | 3.50 |
| Year | GT (mil) | No. of Ships |
|---|---|---|
| 2003 | 25.6 | 3,060 |
| 2004 | 27.7 | 3,110 |
| 2005 | 33.0 | 3,220 |
| 2006 | 34.8 | 3,250 |
| 2007 | 39.6 | 3,550 |
| 2008 | 43.7 | 3,810 |
| 2009 | 45.6 | 3,950 |
| 2010 | 48.8 | 3,980 |
| 2011 | 57.4 | 4,110 |
| 2012 | 65.0 | 4,232 |
| 2013 | 73.6 | 4,379 |
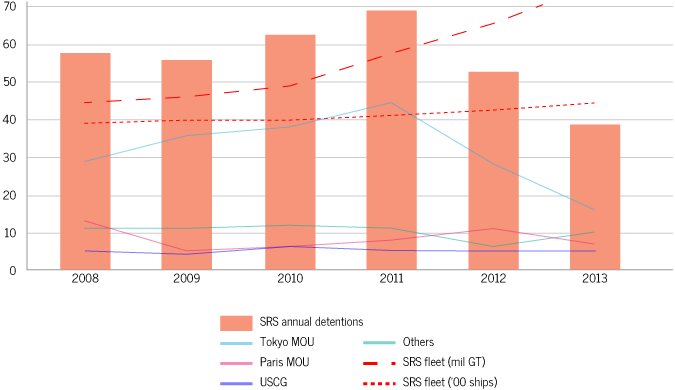
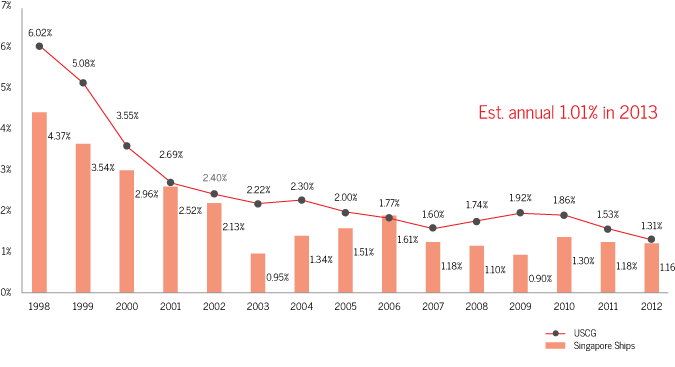
The SRS has consistently registered strong growth over the last decade. Nevertheless, we were able to consistently maintain our good performance under PSC especially in the last two years. The total number of Singapore ships detained worldwide annually has significantly dropped by 44%, from 68 detentions in 2011 to 38 detentions in 2013.
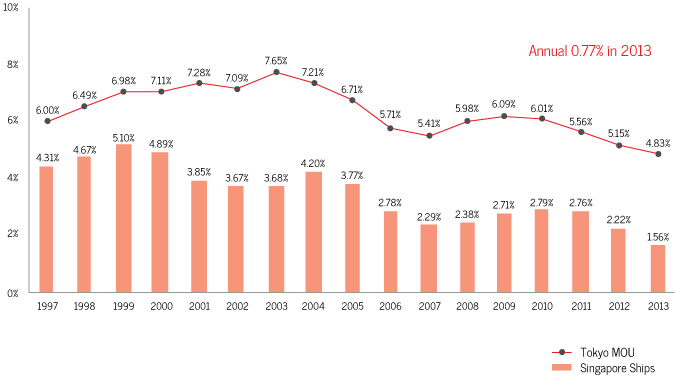
Under the Tokyo MOU PSC regime, the annual detention ratio of SRS is currently 0.77%. Based on a 3-year rolling average, our detention ratio is 1.56% against the regime’s average of 4.83%. The SRS was ranked 5th out of 31 White List flags under this regime in 2012.
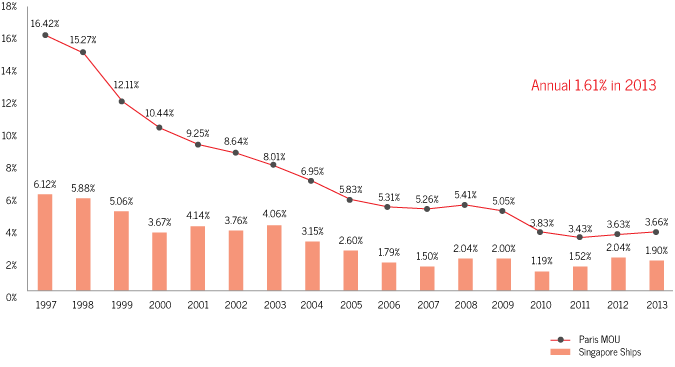
Under the Paris MOU PSC regime, our annual detention ratio is currently 1.61%. Based on a 3-year rolling average, our detention ratio is 1.90% against the regime’s average of 3.68%. The SRS was ranked 16th out of 45 White List flags under this regime in 2012. We are also recognised as a “Flag of Low-Risk Ships”.
Under the United States Qualship 21 programme, where a flag has to have a 3-year rolling average detention ratio of less than 1.0% to be eligible, the SRS managed to qualify in 2004 and 2010. We were looking forward to the SRS qualifying in 2014 but a recent PSC detention by the U.S. Coast Guards has affected our chances.
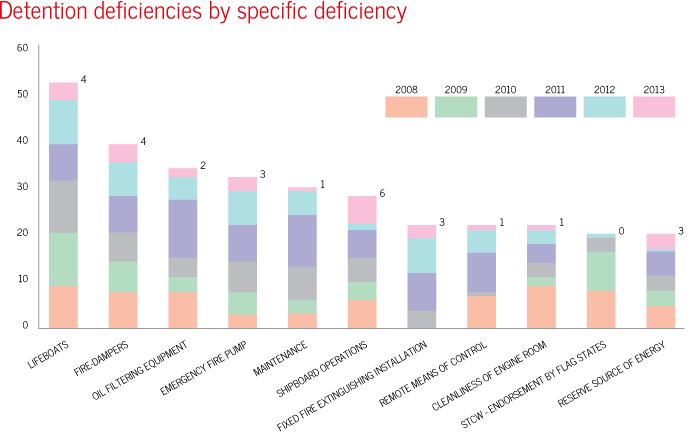
We have been tracking the deficiencies that caused ship detentions in the SRS. Between 2008 and 2013, they were commonly related to fire safety, ISM Code and MARPOL. Lifeboats, fire dampers and oil filtering equipment were among the most common detention deficiencies.
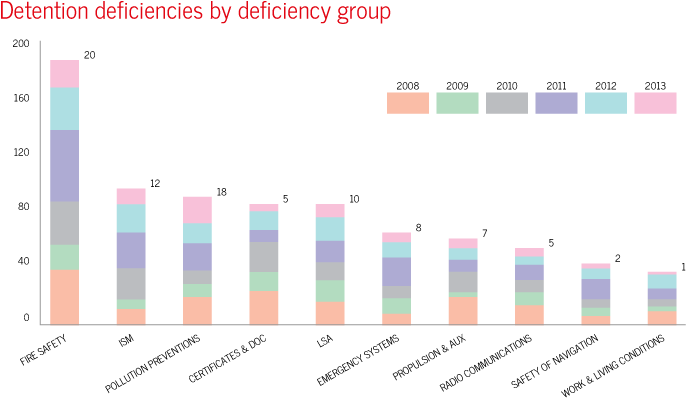
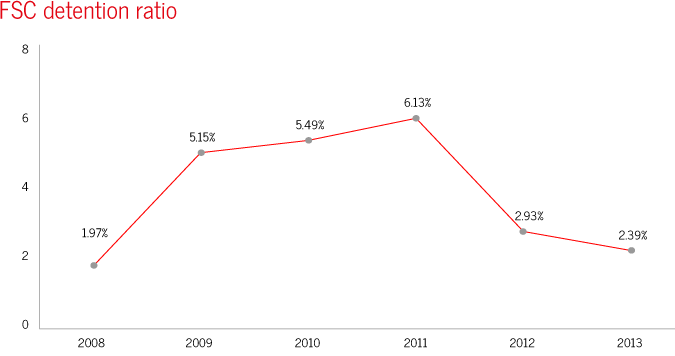
This information has been shared with our shipowners, operators, seafarers and Recognised Organisations, to encourage them to improve the adequacy and implementation of their safety management system. Thanks to their good cooperation and efforts, we have seen significant reduction of Singapore ships detained by MPA during flag State control (FSC) inspections, from 6.23% in 2011 to 2.23% in 2013.
Singapore implemented the Tokyo MOU New Inspection Regime (NIR) with effect from 01 January 2014. Below are some questions and answers in relation to the Tokyo NIR.
What is the New Inspection Regime adopted by the Tokyo Memorandum of Understanding?
The New Inspection Regime is a risk-based ship selection system introduced to replace the existing ship targeting system adopted by the Tokyo MOU in force before 1 January 2014.
Why was the Tokyo MOU NIR established?
The Tokyo MOU NIR was established in response to the recommendation by the 2nd Joint Ministerial Conference of the Paris and Tokyo Memoranda to harmonize PSC procedures between the two regions, taking into account that the Paris MOU had already introduced a NIR from 01 January 2011. Its objective is to reward quality ships with a lighter inspection burden while concentrating on high-risk ships which will be subject to more in-depth and frequent inspections.
How does the Tokyo MOU NIR work?
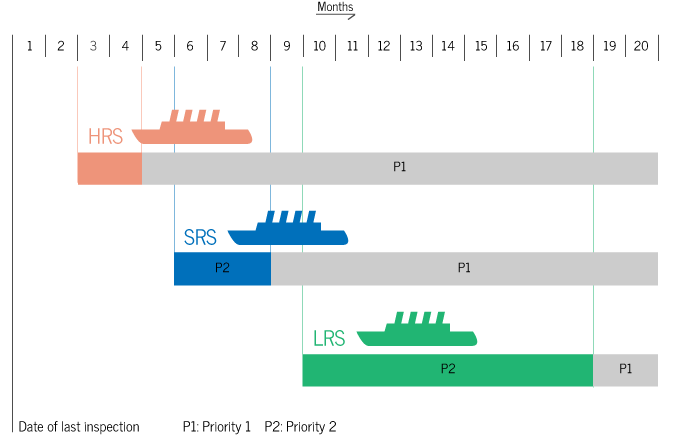
Ships calling to the Tokyo MOU region will be assigned a ship risk profile (SRP) and categorized into high risk ships (HRS), standard risk ships (SRS) and low risk ships (LRS) respectively.
How is the ship risk profile (SRP) determined?
The Ship Risk Profile is being calculated based on the following elements for a preceding 36-month period:
How does a ship’s SRP influence a ship’s frequency and priority of inspection by PSC?
Under the Tokyo MOU NIR, different time windows/inspections would be applied to the corresponding categories of ships in accordance with the ship risk profiles determined e.g. high risk ships may be subject to more regular and frequent inspections while the standard/low risk ships may be rewarded with a wider time window for PSC inspection. In general, low risk ships will be inspected 9 to 18 months after a previous inspection while standard risk ships will be inspected after 5 to 8 months and high risk ships will be inspected every 2 to 4 months. In terms of priority for PSC inspection, if a vessel calls at a Tokyo MOU port within the inspection time window, it will be considered Priority II and may be inspected. If the inspection time window has passed, it will be considered Priority I and will be inspected. The relationship between inspection windows and inspection priorities is illustrated in the Figure below.